Bid × ask inside every candle — with volume profiles, TPO, CVD, the resting order book and bar-by-bar replay, on Bybit, Bitget, Binance and Hyperliquid. Free while it's in beta: no account, no card.
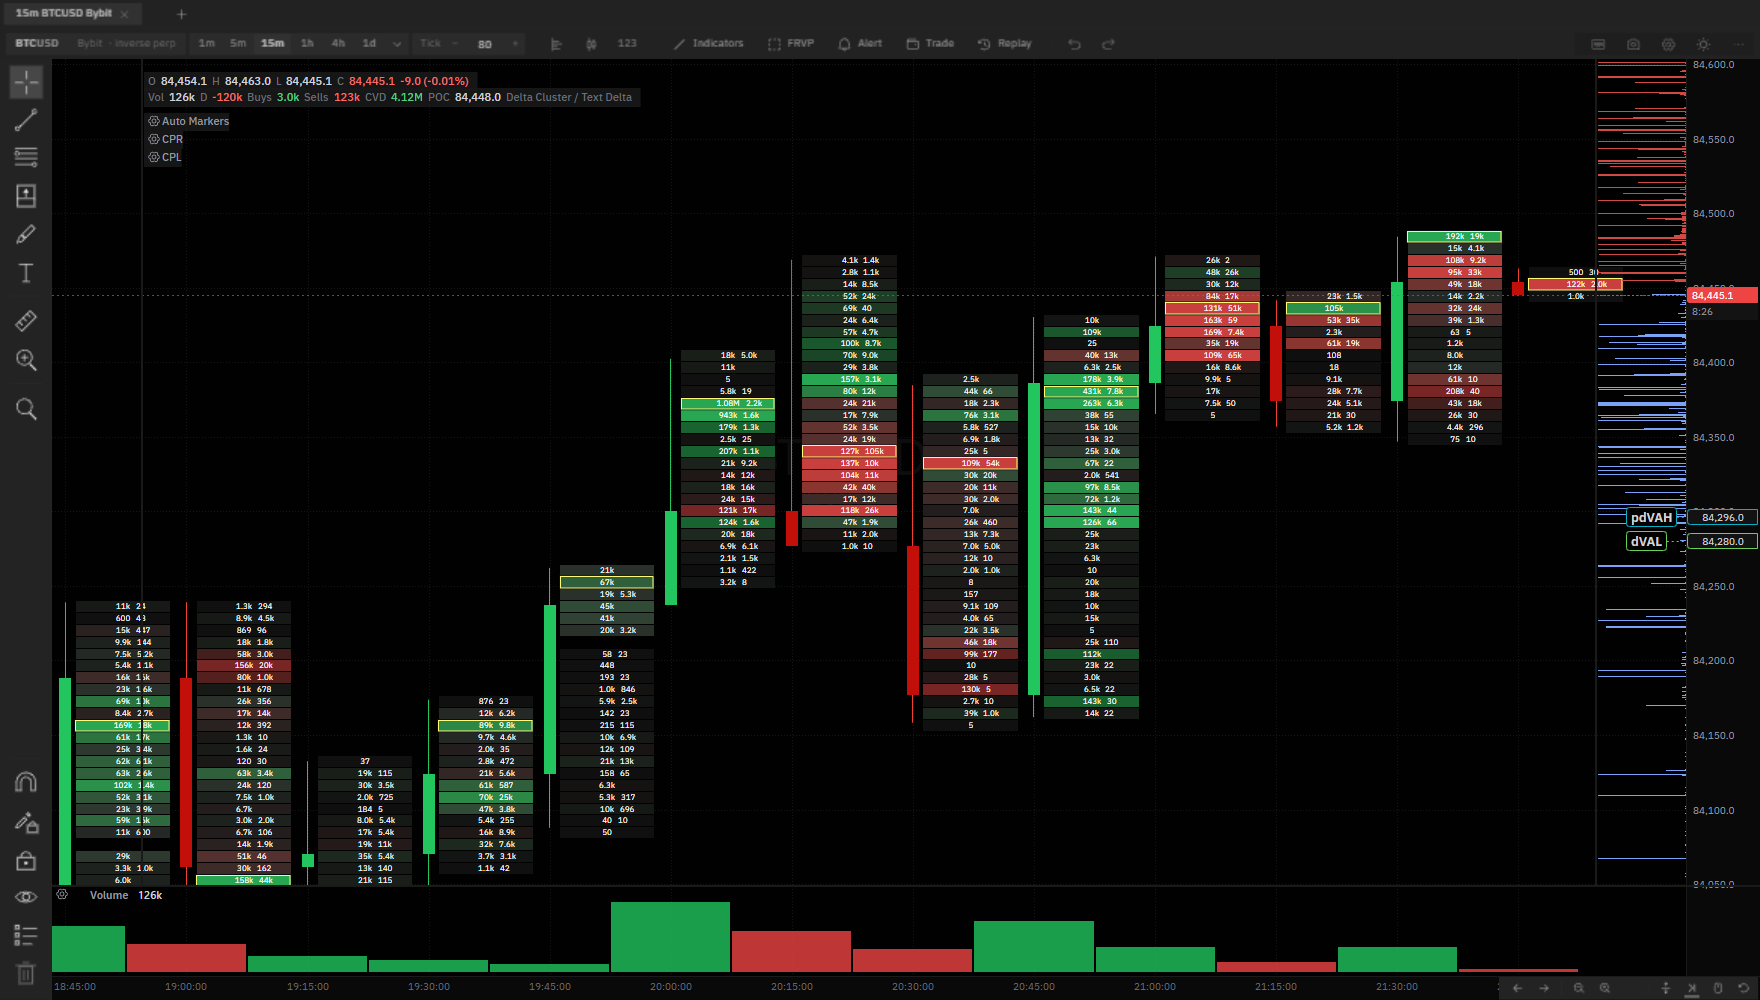
BTCUSDT perp on Bybit, 15-minute footprint. Session levels and the day's value area ride the axis; volume and delta sit underneath.
Every bar carries bid × ask on every price row. Eight cluster types, twelve candle styles, imbalances marked at 2.5×, POC and value area dimmed. Any tick size works — bars roll up from a $1/1m base grid rather than a fixed menu, so the ladder you trade is the ladder you chart.
Zoomed out, rows merge instead of giving up: several ticks draw as one row off a round ladder, volume is conserved exactly, and the cell numbers never merge — a printed figure is always one tick. A strip under each bar carries the footprint statistics: volume, delta, CVD, POC, range, trades.
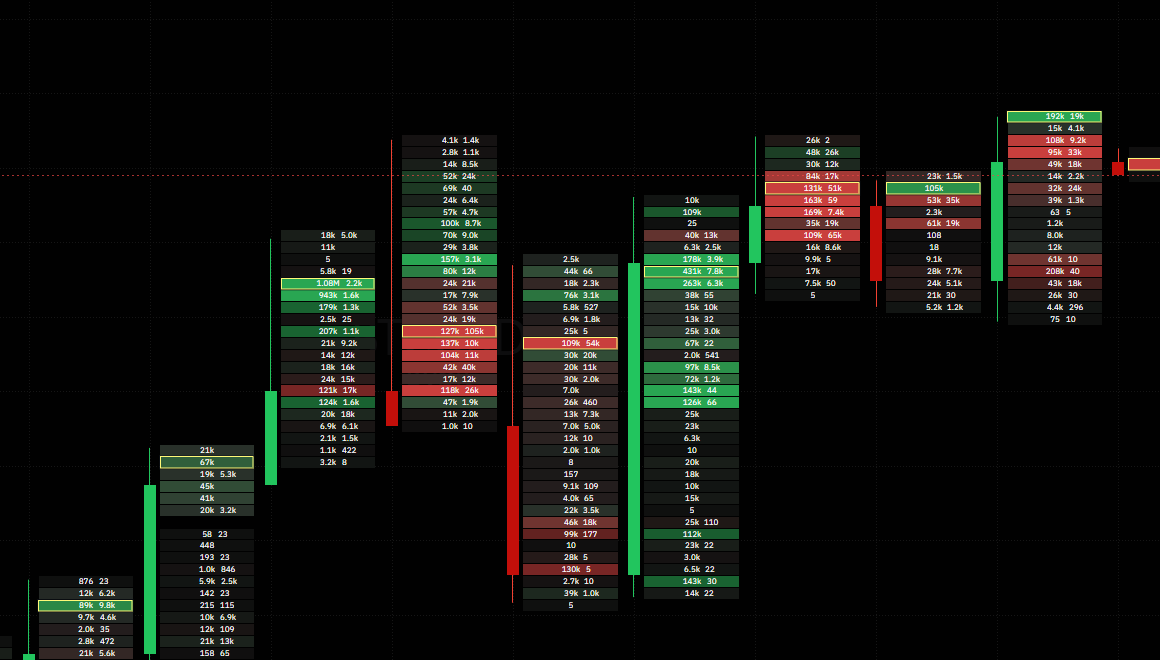
Zoomed in, the ladder reads tick by tick; the diagonal is where the imbalances sit.
The venue's whole ladder is summed into price bins every ten seconds and written to a journal — fourteen days kept. An order that sits at a price for hours is a horizontal line that long, and the line ends the moment it is filled or pulled.
The map's two controls are shares of the book rather than fractions of the biggest wall in it, so a quarter is a quarter whether or not a whale is on screen. The DOM and the tape dock beside the chart as their own panel.
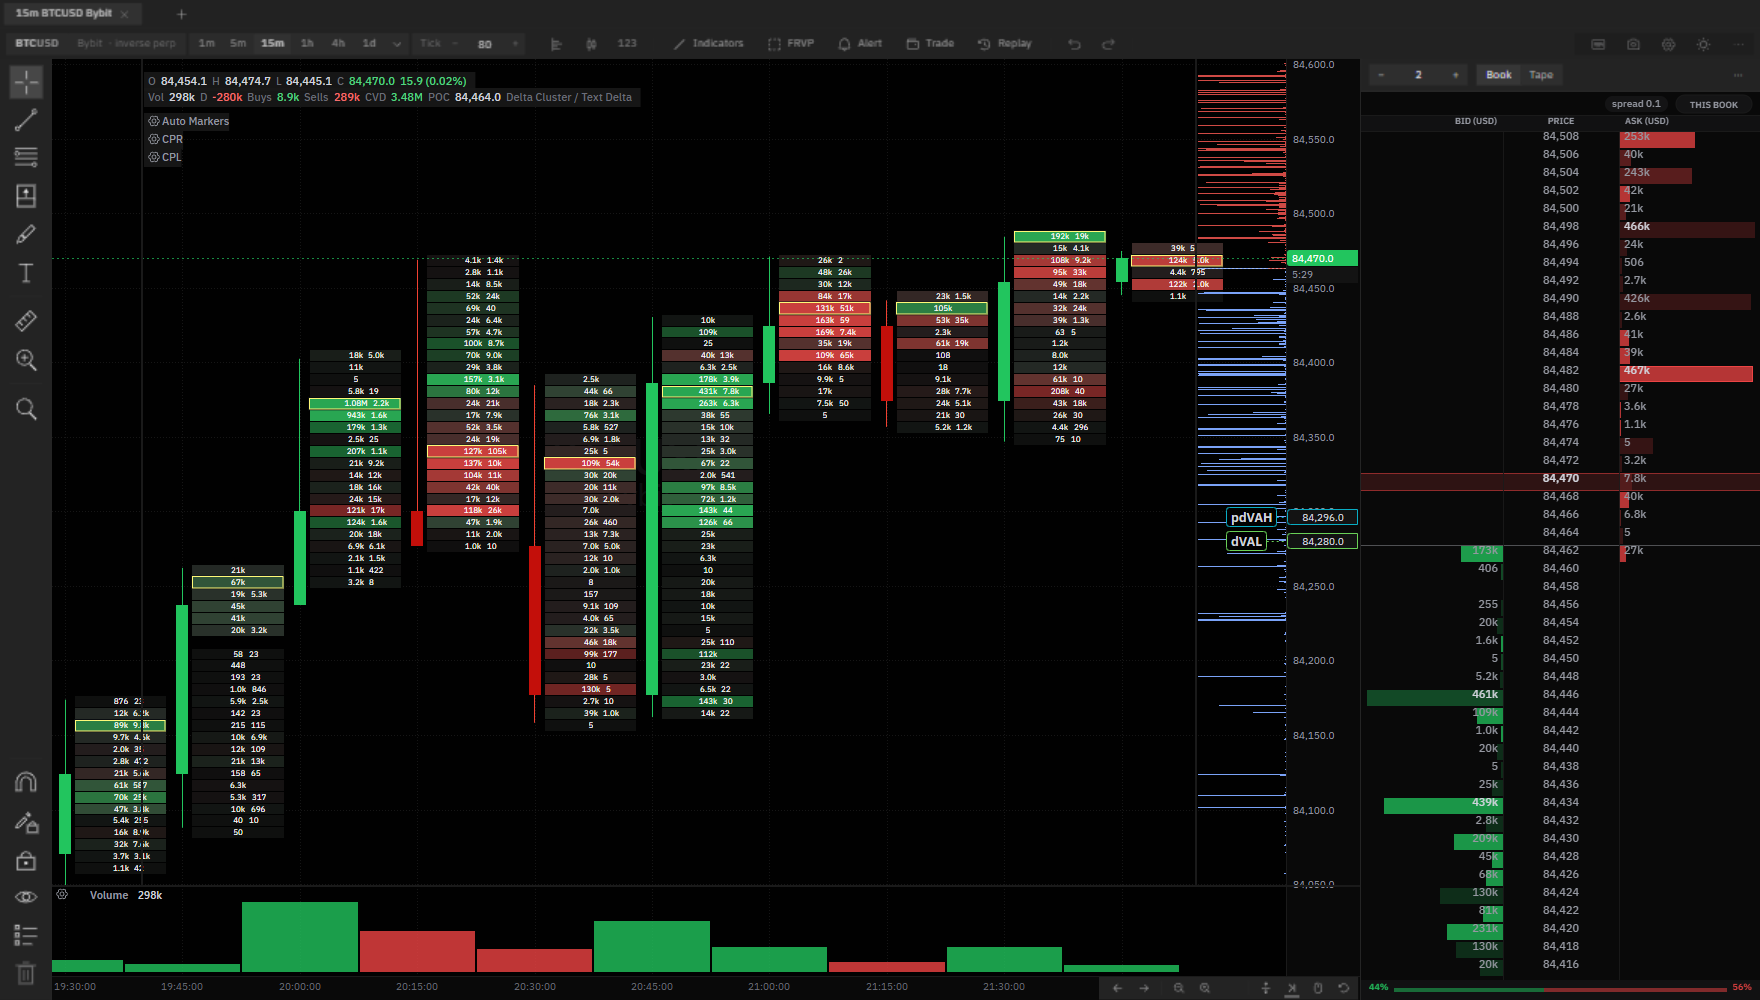
The DOM docked right. The blue and red rows in the gutter are the recorded resting book; the spread and the book imbalance read along its top and foot.
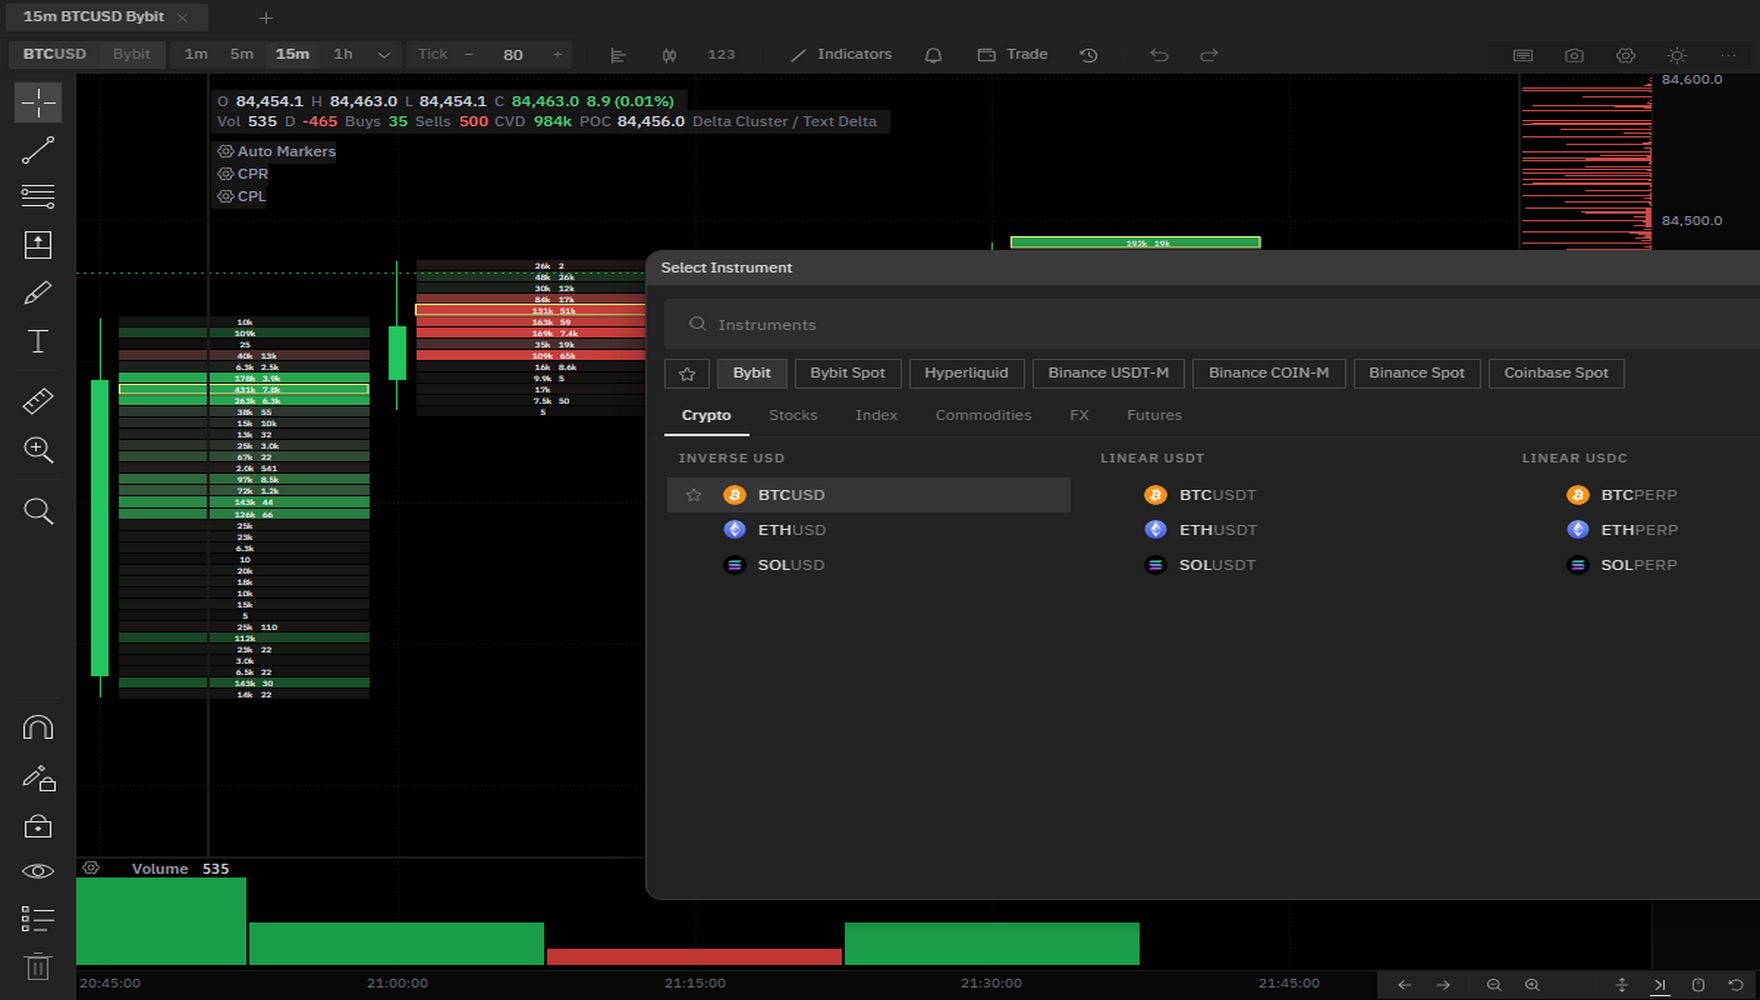
Bybit, Bitget, Binance and Hyperliquid perpetuals — live trades, the depth ladder and open interest straight from each venue. The picker searches everything by name; stars sync into the watchlist on the left rail.
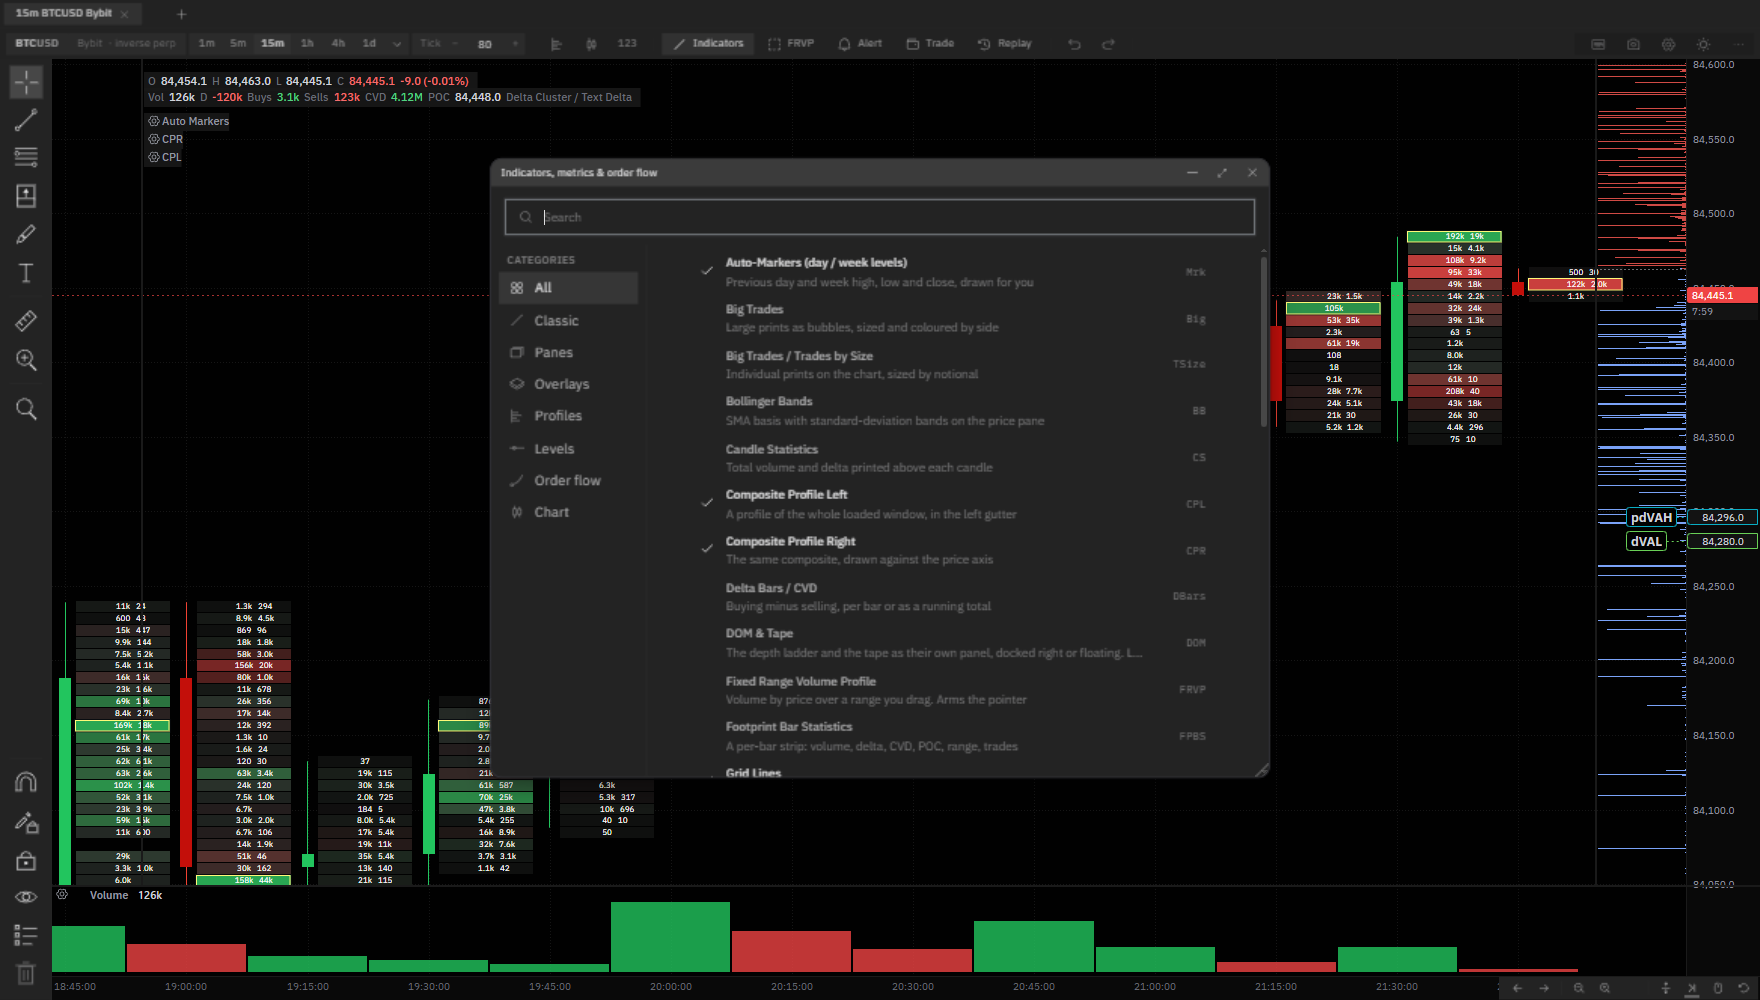
Everything that draws against price is automatic where it can be, and tunable where it can't. Each tool below is an entry in the indicators sheet, searchable, with its own settings page.
Previous day and week high, low and close, drawn for you. While a period is still young its line retracts smoothly as you scroll back.
Time-at-price profiles with initial balance and single prints; CPR and CPL columns against the axis.
VWAP with one, two and three standard-deviation bands, session-anchored.
Estimated liquidation levels and unretested points of control, marked where they belong.
Rebuilds recorded history bar by bar, so yesterday can be traded again today.
Built print by print off the tape and sized in ticks — a Range 40 is forty ticks.
Real menus, real dialogs, keyboard everything — the Windows grammar, not a web page pretending. The indicators sheet searches across every overlay and pane; the settings dialog reads like chart properties: labels left, controls right.
The desktop app updates itself: the chart comes from the site on every launch, and the small launcher checks for its own updates too. No reinstalls, ever.
Both are the same chart, the same data, the same settings. Pick by where you want it to live.
Its own window, real menus, a native title bar with the version in it. Installs per-user — no admin rights — and updates itself.
The installer is not code-signed yet, so Windows SmartScreen shows its standard warning for unfamiliar programs: More info → Run anyway. If you'd rather not click past a warning, the web app is the same chart and installs nothing.
Nothing to install: any modern browser, always the current version, settings in your browser's storage on your own machine.
On a Mac, the web app is the Mac version. Safari's File → Add to Dock turns it into a standalone app with its own window and Dock icon; Chrome and Edge do the same with Install page as app. A native macOS build is planned.
It's a beta and it changes most days. Everything on this page is open to everyone, and there is no payment page on this site to find. One day, when it's finished, it may cost money; the people who charted on it while it was being built will keep their access.
The chart updates itself; an open tab reloads when the build changes.
Is it really free?
Yes. During beta there is no paid tier anywhere and no account. If it ever charges, the people who used it during beta keep their access.
Do I need an account?
No. Open the web app and chart. Your settings live in your browser's storage, on your own machine; there is no login and nothing is emailed.
Which exchanges are supported?
Bybit, Bitget, Binance and Hyperliquid perpetuals, with aggregated books where the venue provides one.
Does it run on Mac or Linux?
The web app runs in any modern browser on any operating system — on macOS, Safari's File → Add to Dock gives it to you as a standalone app. The desktop build is Windows 10/11 only.
Is it affiliated with the exchanges?
No. It's an independent charting tool. Market data belongs to the exchanges; charts are informational only and are not trading advice; trading futures involves substantial risk of loss.
 liquiditycharts®